Ptychography
In ptychography we solve the so called phase problem. In a conventional phase contrast image the phases contributing to the image remain unknown, but in ptychography we solve for the relative phases of the spatial frequencies themselves. This makes ptychography extremely sensitive and dose efficient, and allows it to provide advantages such as post collection aberration correction and superresolution.
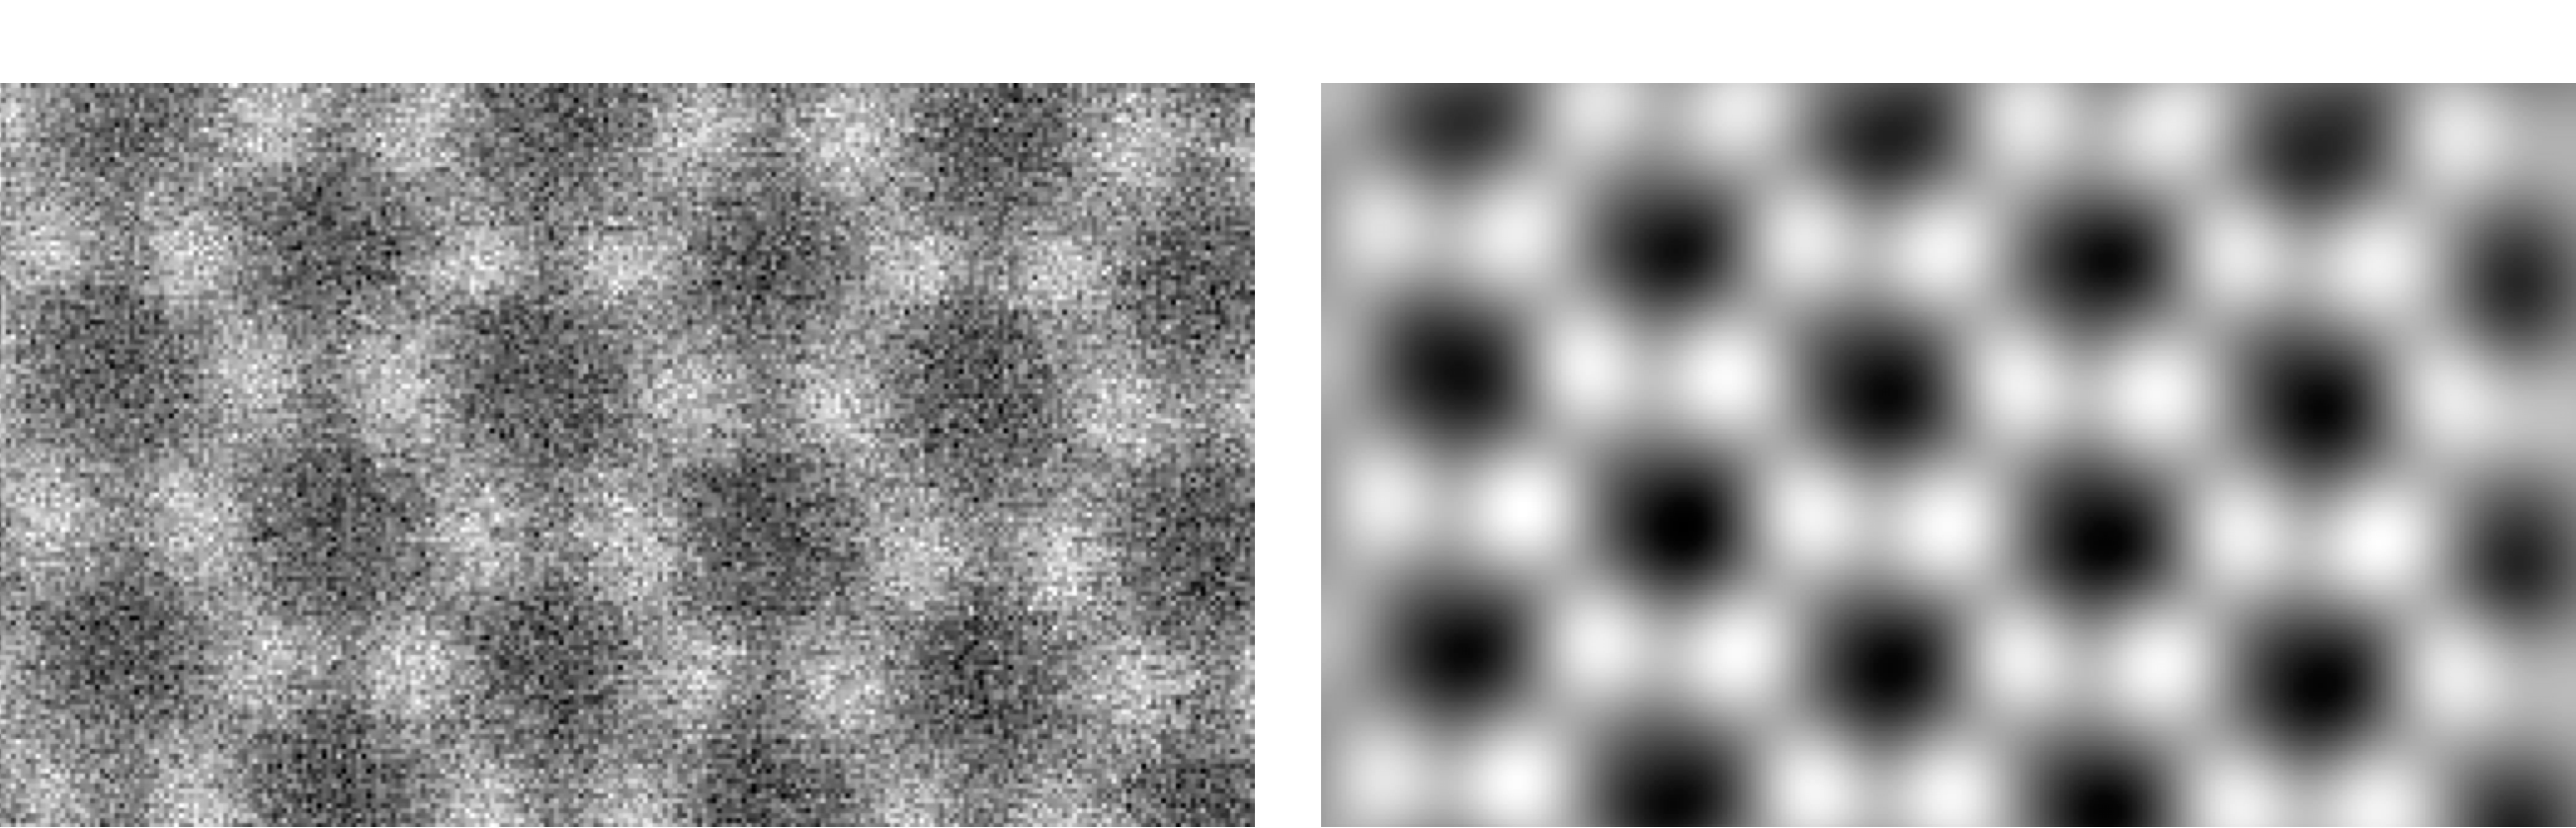 Experimental ADF and SSB ptychography images of graphene collected simultaneously showing how much stronger the ptychography signal is compared to the ADF signal.
It can also outperform conventional TEM at low doses.
How does it work?
In direct ptychography (both SSB and WDD) the relative phases of diffracted convergent beam electron diffraction (CBED) disks are solved via their mutual interference with the direct beam in probe position reciprocal space.

Above is schematic of the overlap of the diffracted disks arranged as they would be in the detector plane from the first ring of spots in graphene, hence the hexagonal symmetry. The central disk is the direct beam. The other disks oscillate as the probe is scanned.
If we take the Fourier transform with respect to probe position we are able to isolate the interference of the disks corresponding to each spatial frequencies with the direct beam.
In probe reciprocal space we obtain phase and amplitude as a function of both scattering angle and spatial frequency. If we display the phase as a function of scattering angle for a single spatial frequency we obtain for the frequencies aligned along the horizontal something like the following, where the red and blue regions are π out of phase.


It looks much the same for the other two independent pairs of spatial frequencies, except the selected disks have rotated around.

Each double disk overlap (where the diffracted disk and direct beam overlap) also contains the amplitude of the spatial frequency. Here we will just show the one diagram.
In the SSB method, the phase and amplitude of each spatial frequency is determined by integrating over its double disk overlap region in probe reciprocal space.
Once the phase and amplitude are determined for each spatial frequency, performing Fourier transforming back to real space interferes all the frequencies and produces a phase image.
For further details
“Efficient Phase Contrast Imaging in STEM Using a
Pixelated Detector. Part 1: Experimental Demonstration at Atomic
Resolution”,
T. J. Pennycook, H. Yang, L. Jones, A. R. Lupini, M. F. Murfitt and
P. D. Nellist, Ultramicroscopy 151, (2015), p. 160.